CFD CASE STUDY/CAR-PARK VENTILATION
CFD assessment of CO ventilation in a basement car park
Reviewing carbon monoxide distribution and airflow across two residential basement levels.
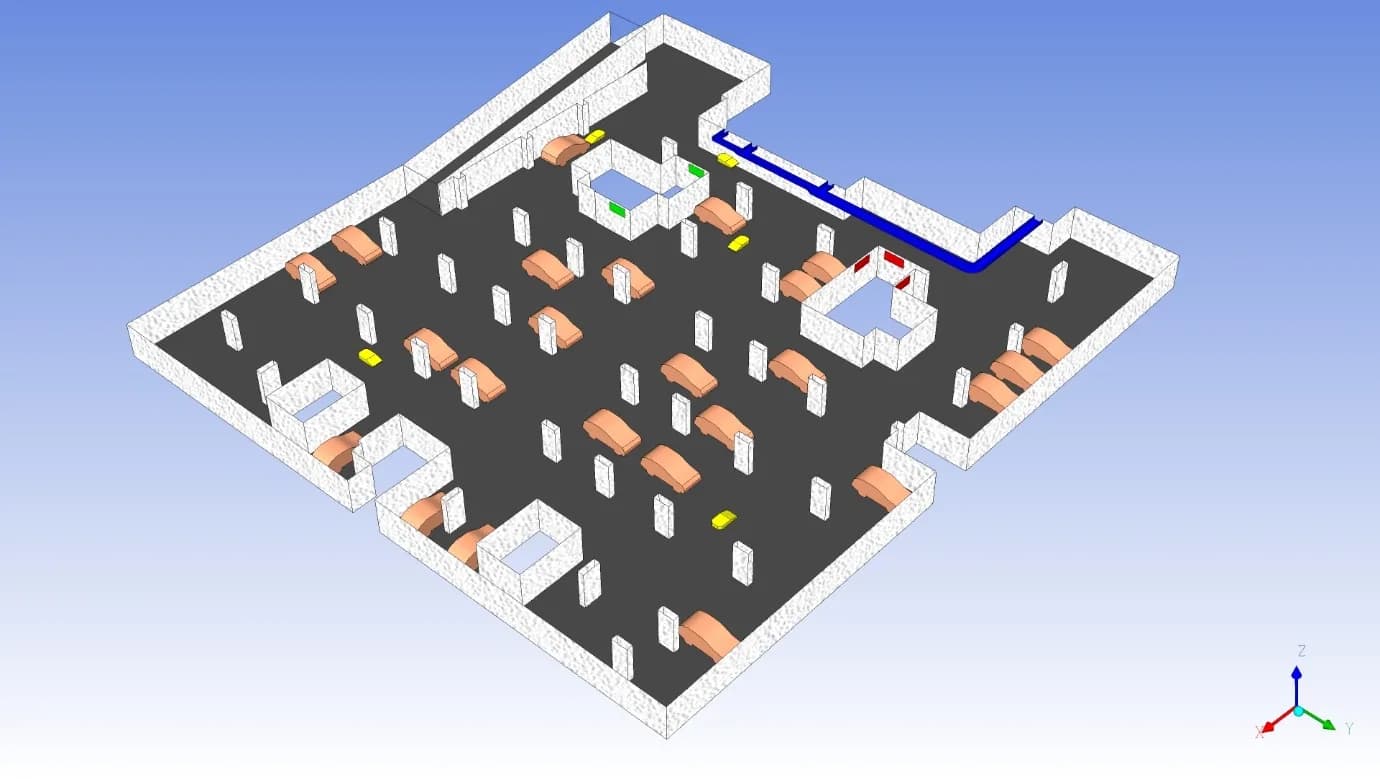
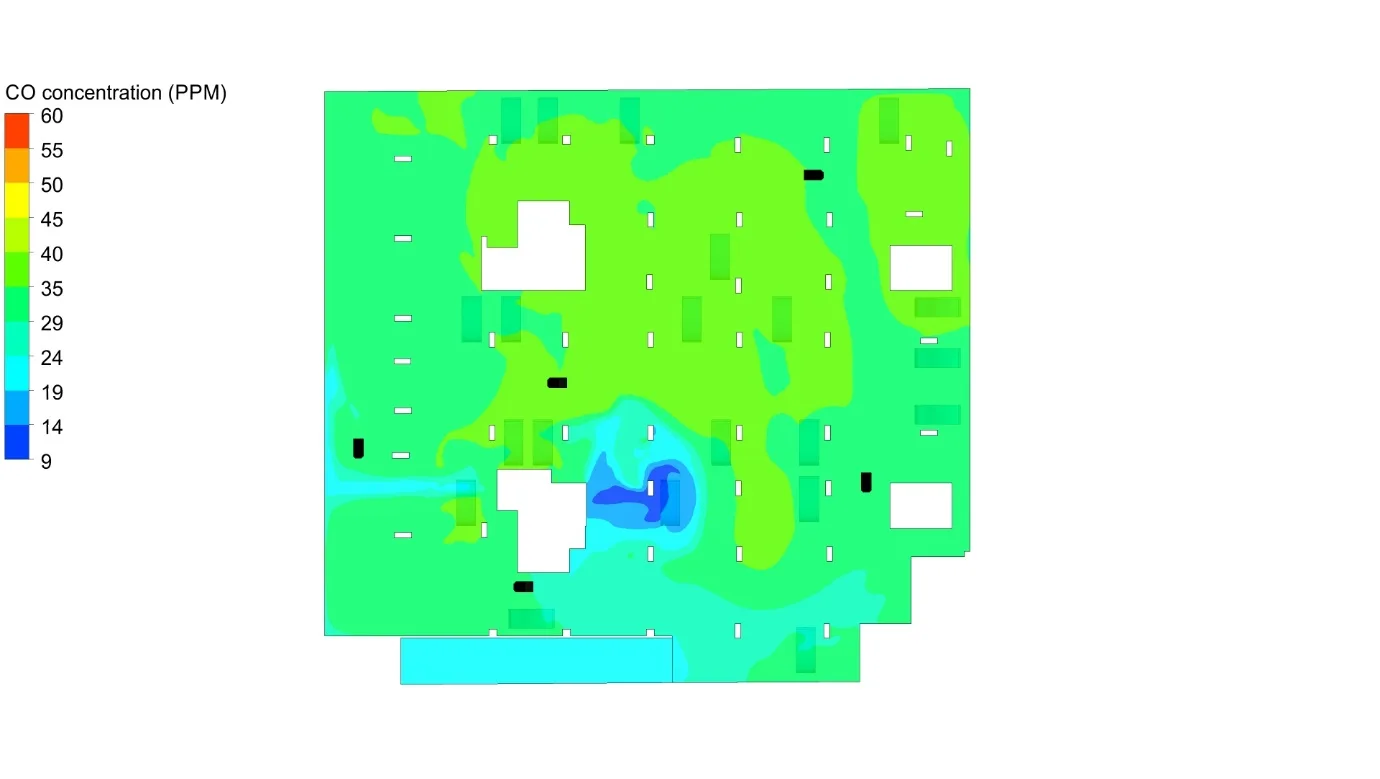
Original project geometry · Basement 1
- Application
- Residential car park
- Scope
- Two basement levels
- Capacity
- 150 parking spaces
- Assessment plane
- 1.5 m above the floor
01 / THE CHALLENGE
Assess pollutant distribution across two basement levels
Graphler Technology Solutions used Computational Fluid Dynamics (CFD) to assess carbon monoxide (CO) concentrations in a proposed residential car park with 150 parking spaces across two basement levels.
The engineering question was how the proposed supply, exhaust and jet-fan arrangements distributed air through the parking areas. Each level had its own ventilation arrangement, so the assessment examined Basement 1 and Basement 2 separately.
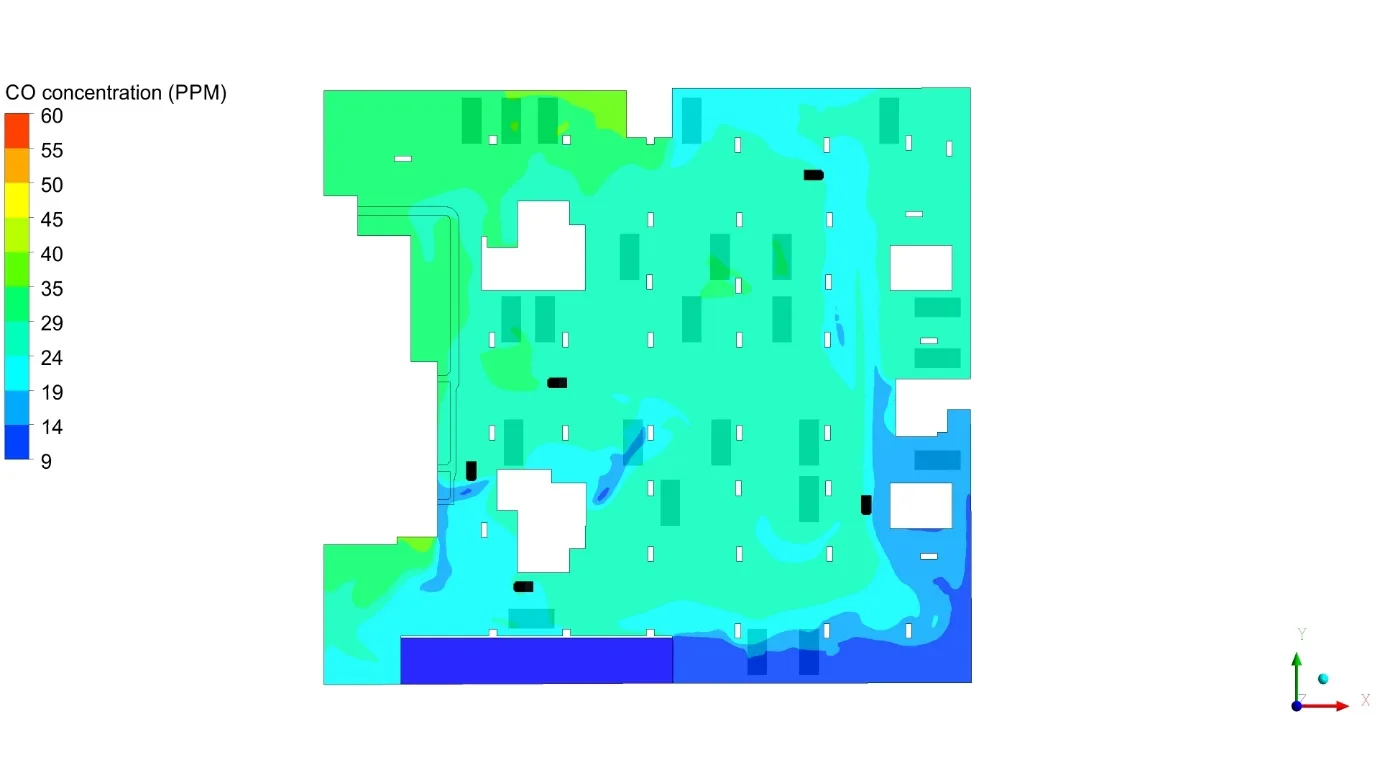
The study reviewed CO concentration at a horizontal plane 1.5 m above the floor. This gave the design team a spatial view of the predicted pollutant distribution alongside the airflow patterns.
02 / OUR APPROACH
Represent the parking layout and ventilation paths
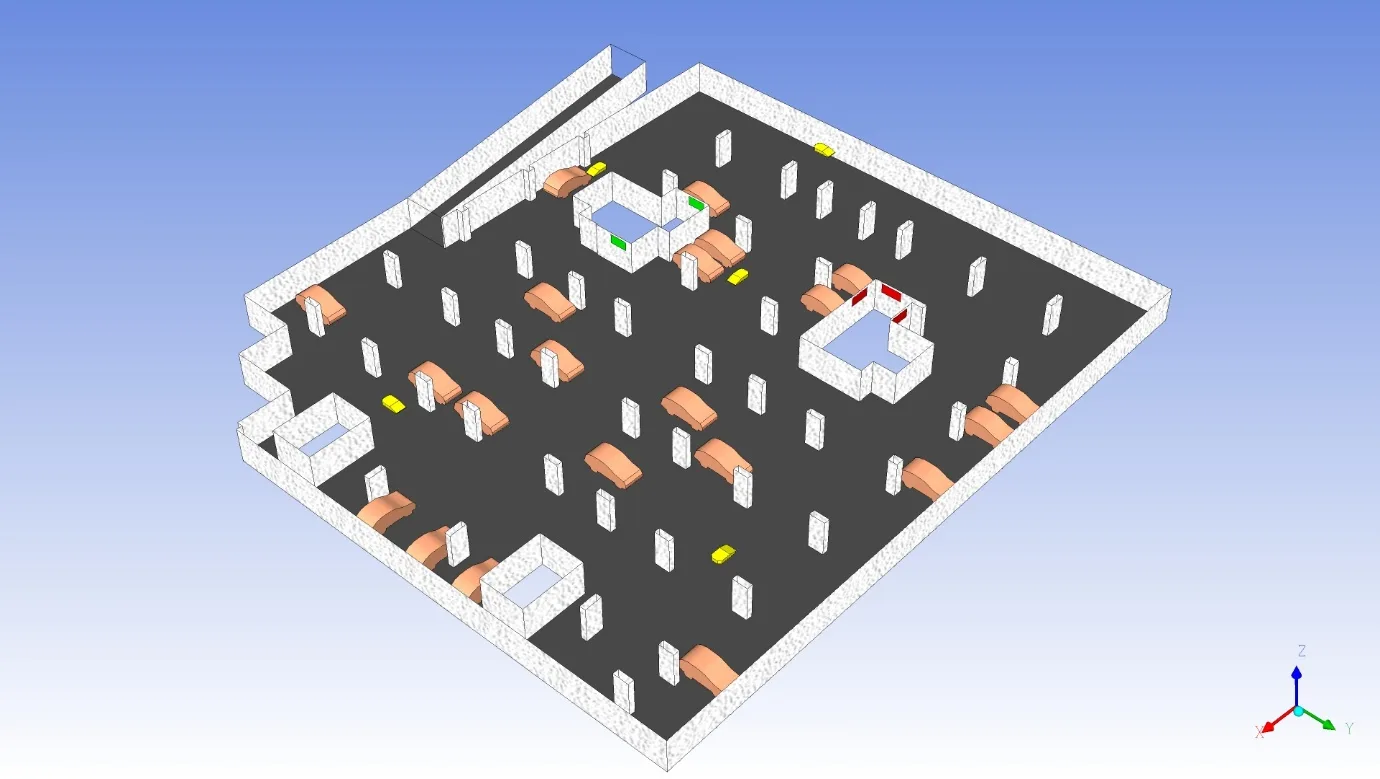
The CFD models represented the basement geometry, parked vehicles, columns and ventilation equipment. Supply and exhaust grilles, jet fans and the car-park entry/exit formed part of the documented setup.
| Level | Parking spaces | CO generation |
|---|---|---|
| Basement 1 | 70 | 952 g/h |
| Basement 2 | 80 | 792 g/h |
The report assigned a separate CO generation rate to each level and examined the resulting concentration field. These are model inputs; the parking-space count alone does not determine the emission rate.
Model each basement
Represent the geometry, vehicles and ventilation arrangement.
Apply the CO sources
Use the documented generation rate for each level.
Review the results
Read the concentration field together with the airflow paths.
03 / THE FINDINGS
Report summary at 1.5 m
The report states average CO concentrations of 25 ppm in Basement 1 and 33 ppm in Basement 2 at the 1.5 m plane. It records a maximum of 37 ppm for each level.
- Basement 1
- 25ppm
- Basement 2
- 33ppm
Reported average at 1.5 m
Reported maximum: 37 ppm
Reported average at 1.5 m
Reported maximum: 37 ppm
Values are transcribed from the report summary; the underlying numerical results were not available for independent reconciliation with the contour plots.
ppm means parts per million. The report cites a 60 ppm, one-hour maximum-average CO criterion under AS 1668.2. The values above reproduce its reported results; a time history or one-hour averaging calculation is not provided.
Read the airflow alongside the concentration field
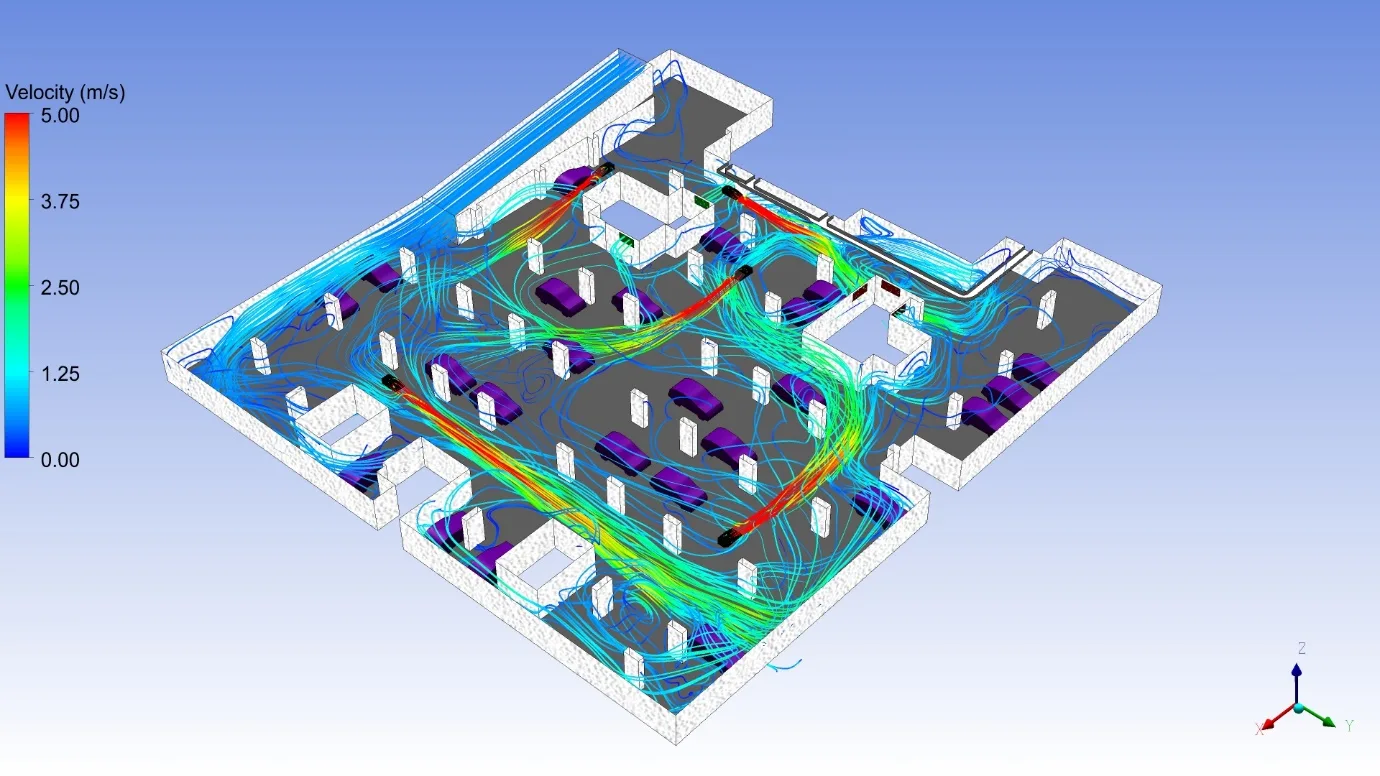
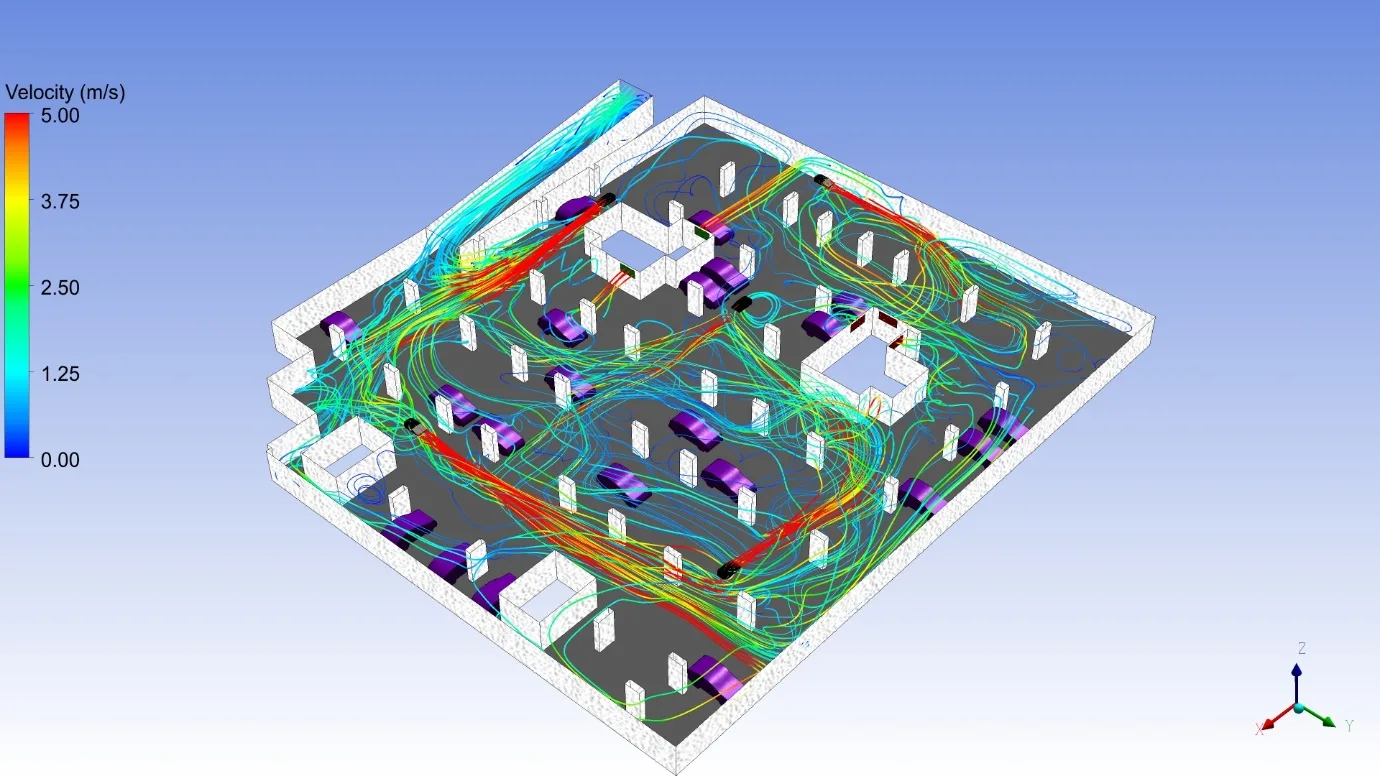
The original streamline views show the predicted air paths around vehicles, columns and internal obstructions. They provide context for the concentration plots and the interaction between the jet fans and the wider ventilation arrangement.
04 / ENGINEERING VALUE
Make the ventilation assessment visible
The study connected the proposed ventilation arrangement with predicted CO distribution in each basement. Reporting the two levels separately made their different average concentrations visible, while the airflow images helped explain the movement of air through the modelled spaces.
This provided a documented basis for reviewing the car-park ventilation design under the stated inputs. The reported maximum concentrations were below the numerical benchmark cited in the study.
Assessment scope
These are numerical results from the documented operating scenario. They do not establish field performance, current regulatory compliance or performance under a vehicle-fire scenario.
05 / RELATED CONTEXT
Fire, smoke and visibility
This project assessed CO during normal operation. Fire-driven smoke movement and visibility distance were outside the reported scope.
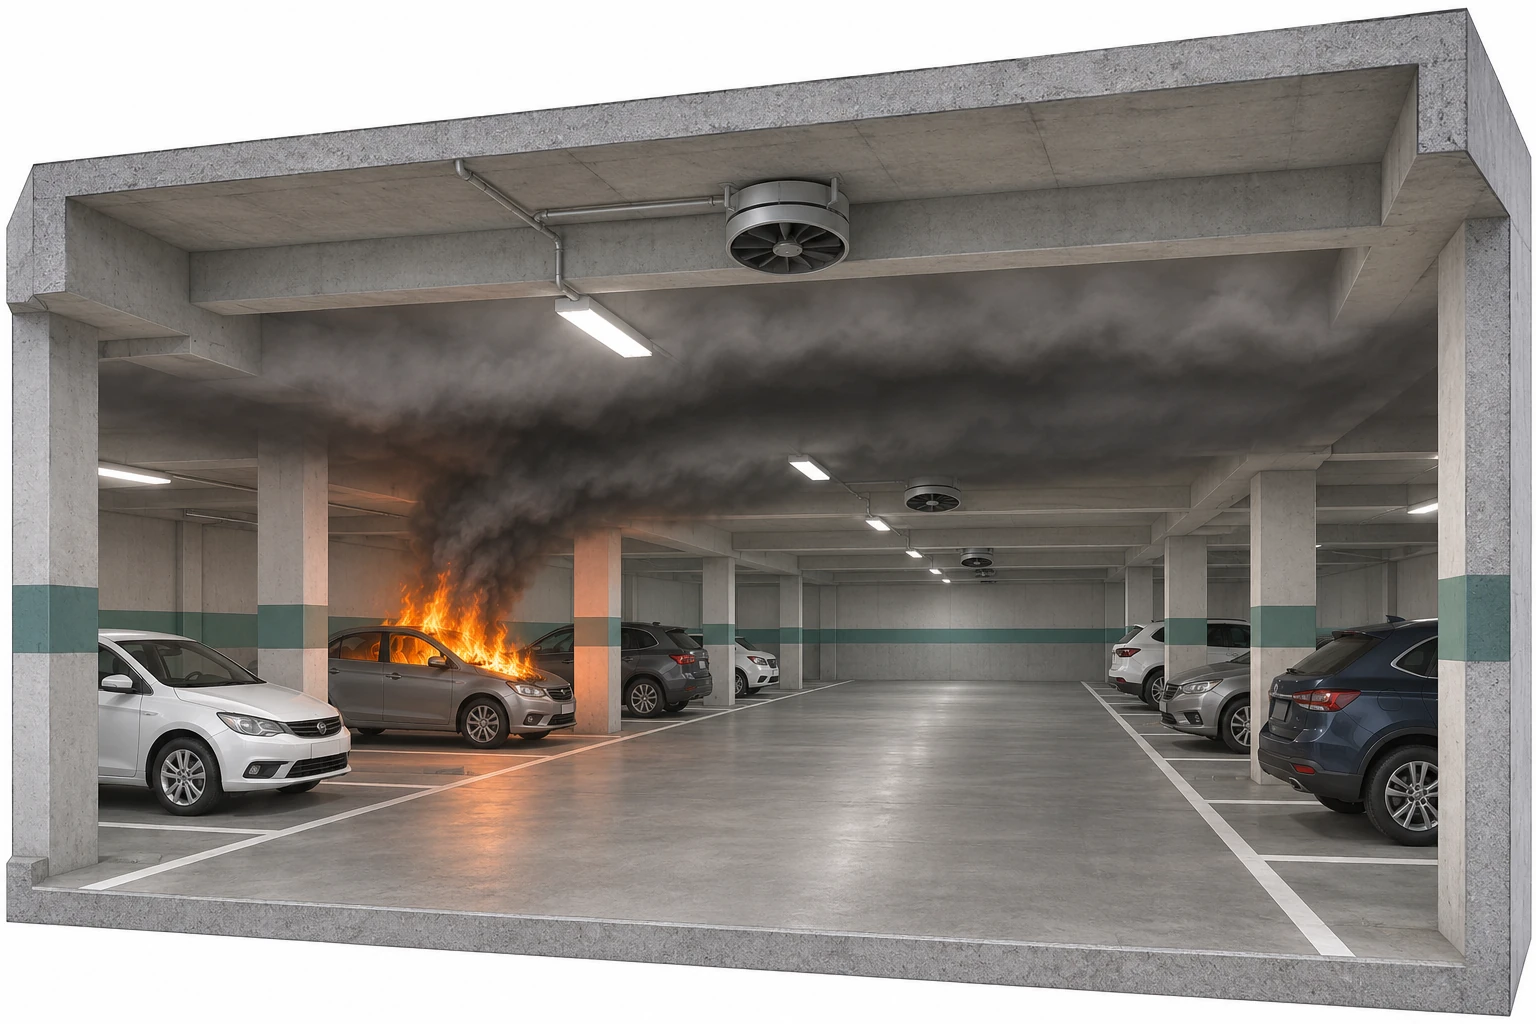
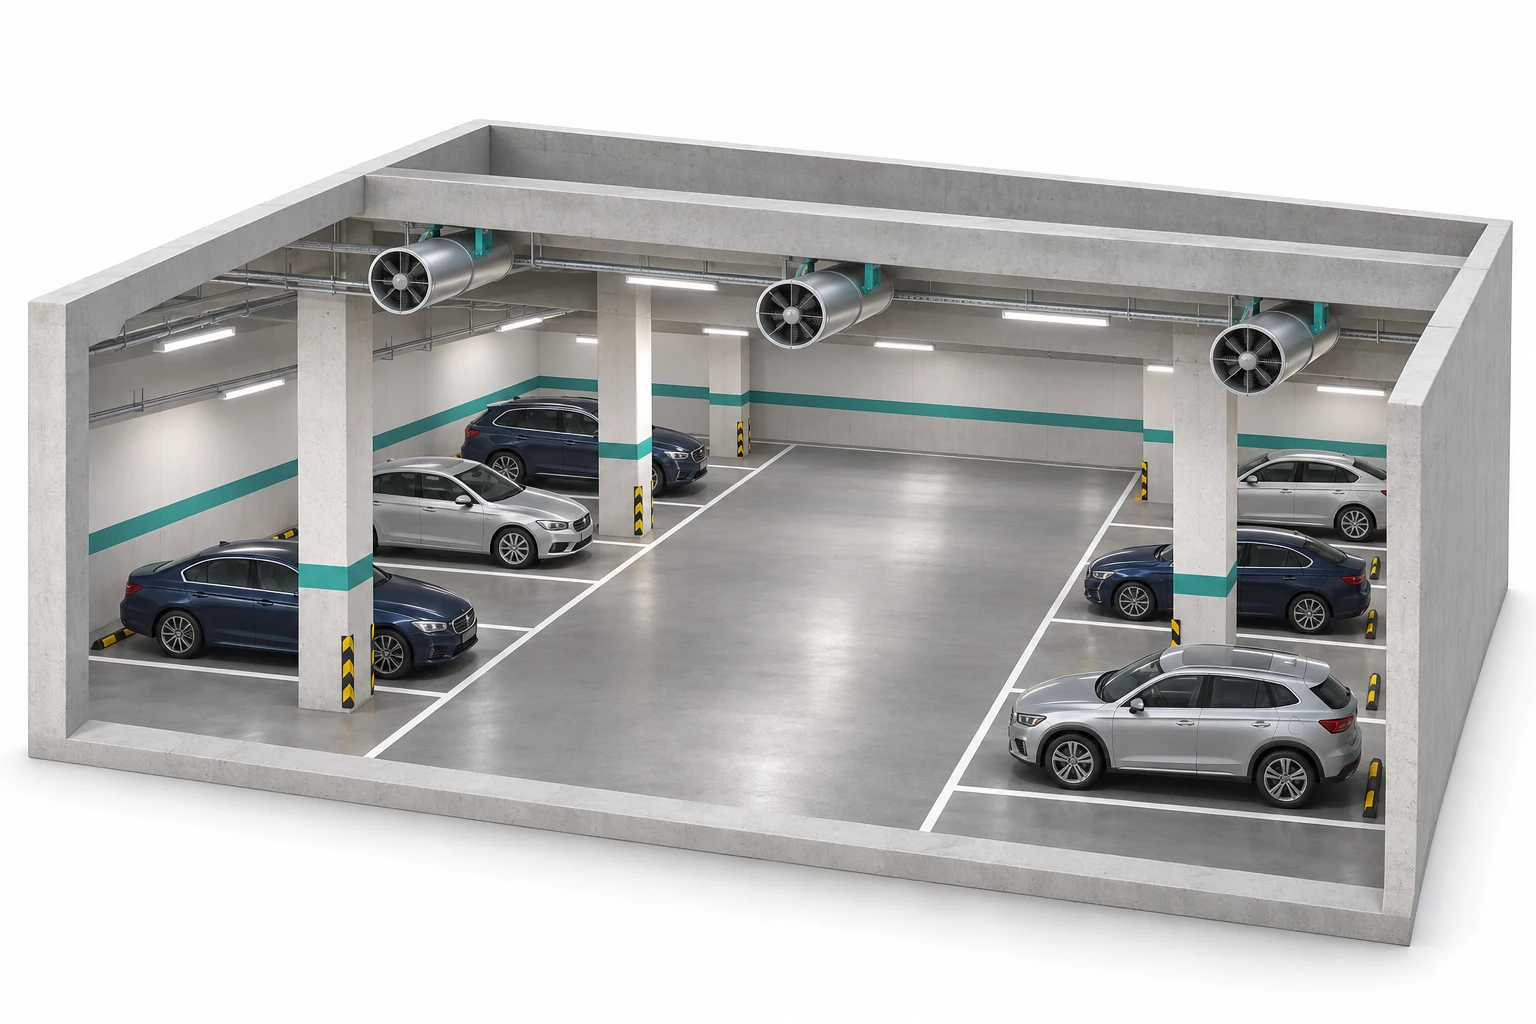
The illustration shows the subject of a separate fire assessment. The supplied report contains no fire or smoke contours and no calculated visibility index or distance to reproduce here.
- CO concentration
- Reported CFD results
- Fire and smoke
- Illustration only
- Visibility
- Not assessed in this report
Graphler Technology Solutions
Engineering design, simulation and product development.
About our engineering team
YOUR NEXT ENGINEERING QUESTION
Review your car-park
ventilation design.
Share the basement layouts, ventilation arrangement and operating assumptions. We can define a CFD assessment of airflow and pollutant distribution for your project.
Discuss an HVAC CFD projectExplore HVAC CFD services