CFD CASE STUDY/TUNNEL VENTILATION
CFD assessment of road tunnel ventilation
Assessing jet-fan airflow and carbon monoxide distribution against a project concentration criterion.
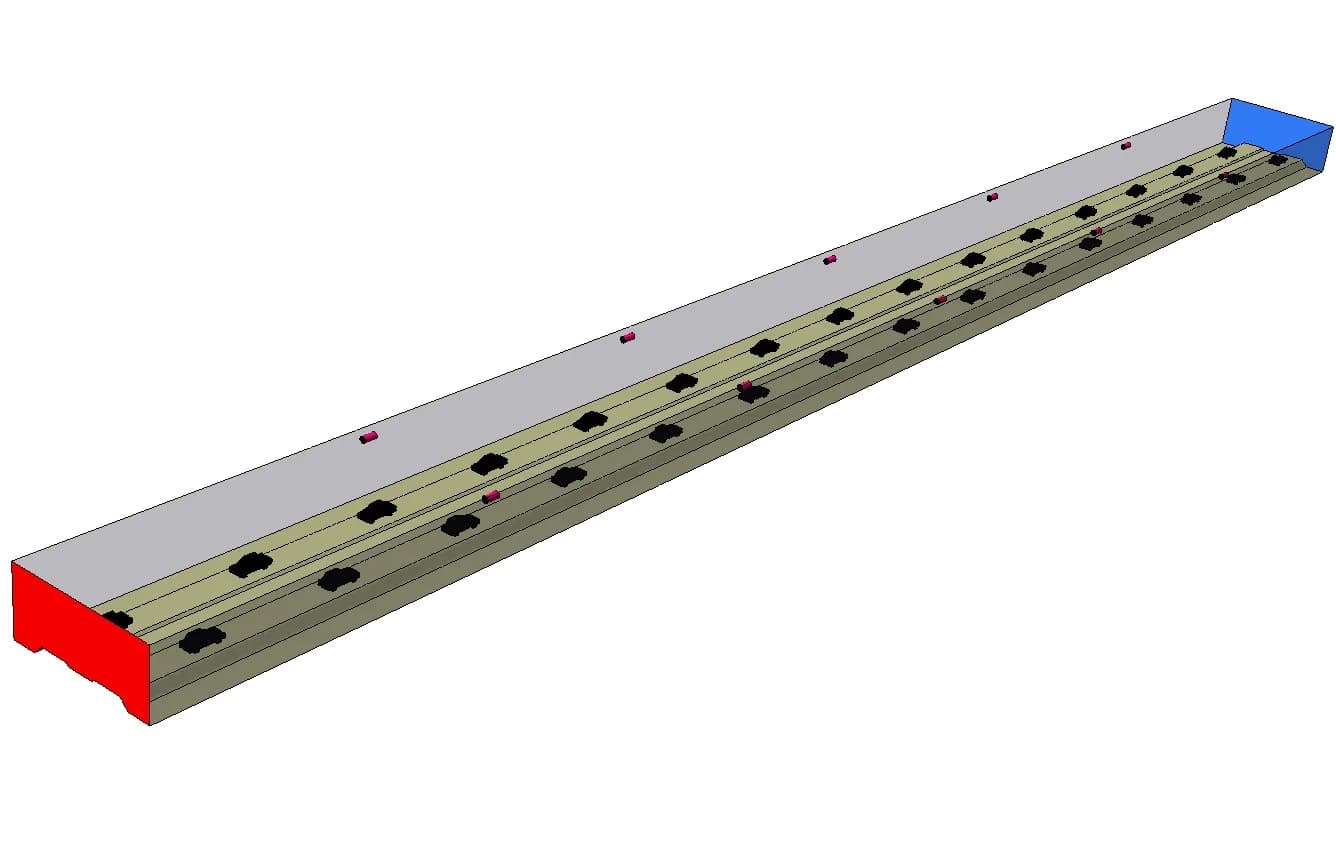
Original project geometry · tunnel, vehicles and jet fans
- Application
- Road tunnel ventilation
- Method
- Computational Fluid Dynamics
- Fan arrangement
- 5 jet fans per lane
- Assessment focus
- Carbon monoxide distribution
01 / THE CHALLENGE
Review CO distribution through the tunnel
Graphler Technology Solutions used Computational Fluid Dynamics (CFD) to evaluate a road-tunnel ventilation arrangement with jet fans and vehicle emissions. The assessment focused on carbon monoxide (CO) concentration against a project acceptance criterion of 60 ppm.
The engineering task was to examine how air moved through the tunnel and how the resulting flow distributed CO around the vehicles. The concentration field provided the acceptance check, while velocity contours and streamlines helped explain the flow pattern.
02 / OUR APPROACH
Represent the geometry, vehicles and jet fans
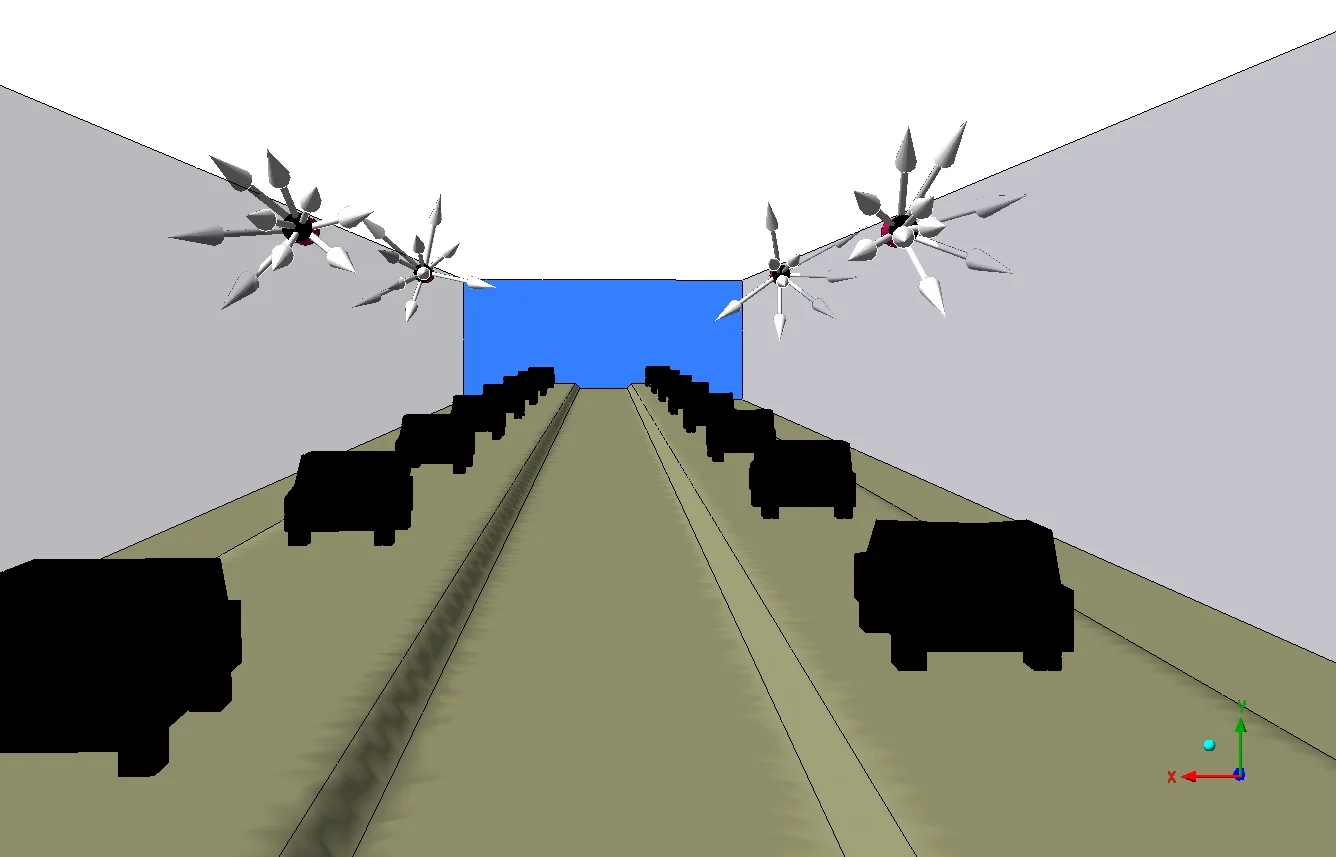
The three-dimensional CFD domain was developed from the supplied drawings. It included the tunnel boundaries, vehicle geometry and jet-fan arrangement. The documented setup specified five jet fans per lane.
| Input | Stated value |
|---|---|
| Jet fans | 5 per lane |
| Vehicle travel speed | 30 km/h |
| Vehicle crossing time | 90 s |
| Tunnel-end pressure | 1 atm |
| Ambient CO concentration | 1 ppm |
The 90-second value describes the vehicle crossing input. It is not a stated simulation duration or pollutant-clearance time.
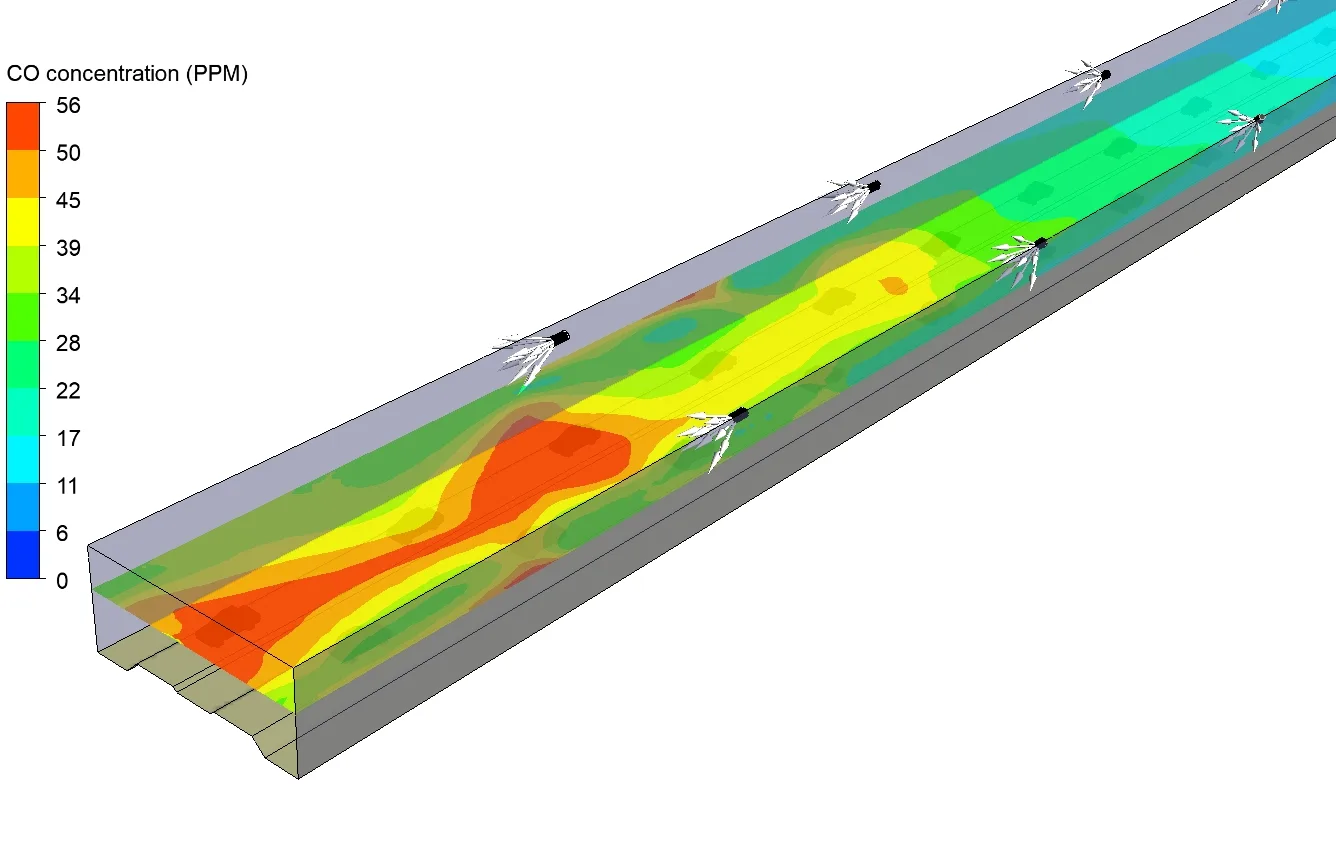
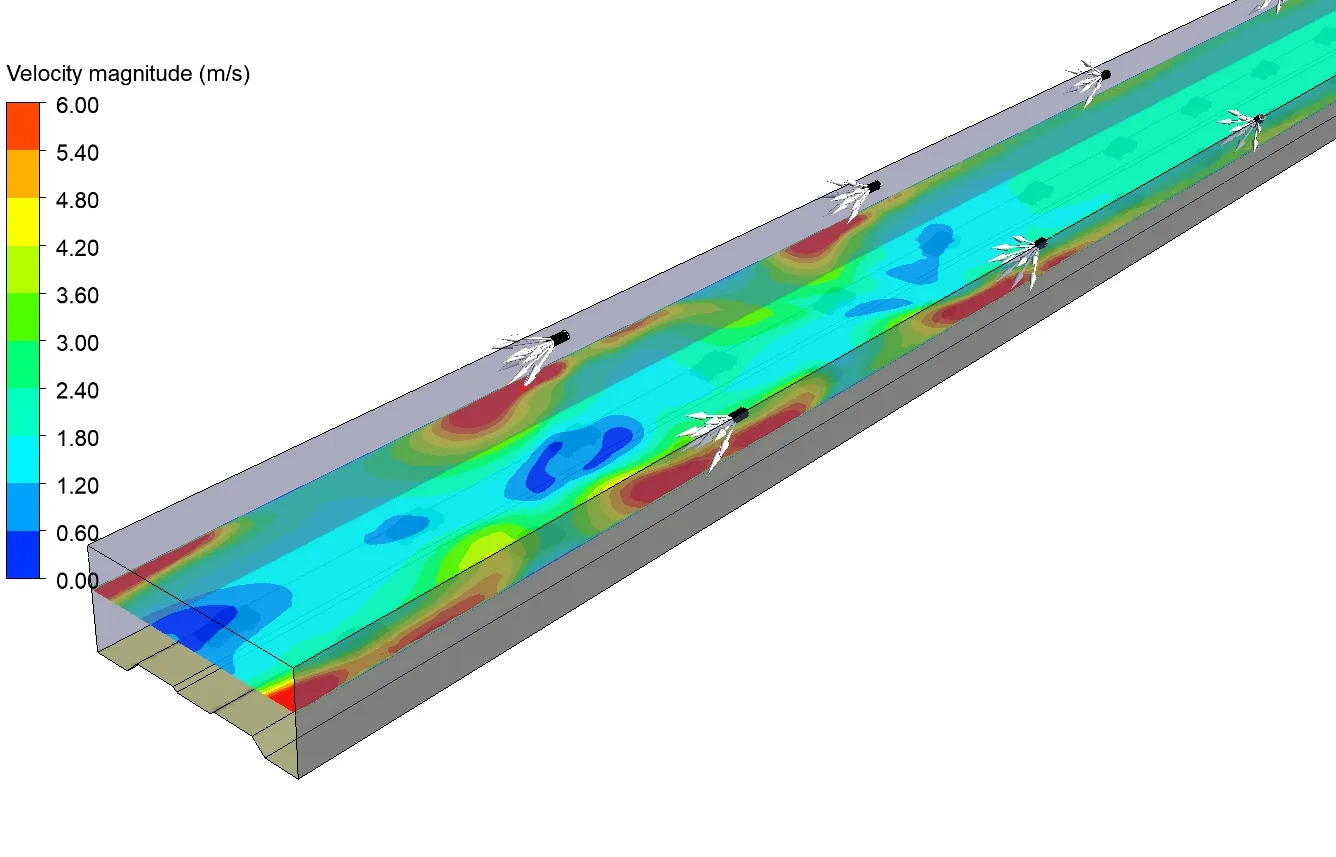
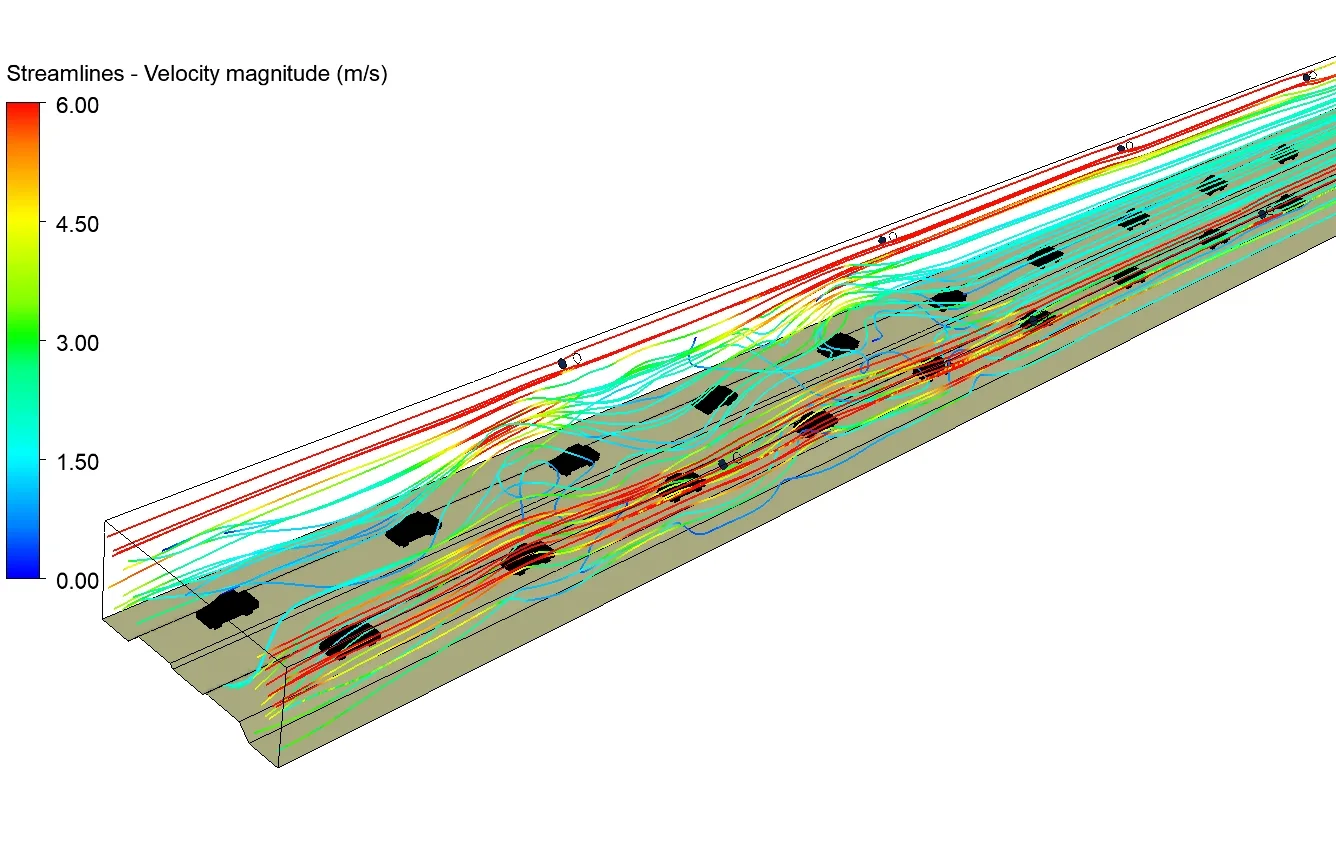
The study reviewed velocity and CO on a section identified as Result Plane 03, together with streamlines through the tunnel. These views connected the ventilation arrangement with the predicted flow and concentration fields.
03 / THE FINDINGS
Reported maximum CO was below the criterion
The study reports a maximum CO concentration of 56 ppm, compared with its stated acceptance criterion of 60 ppm. This is a comparison for the documented model and operating assumptions.
- Reported maximum CO
- 56ppm
- Project acceptance criterion
- 60ppm
Numerical study result
Benchmark stated in the source
ppm means parts per million. The source does not identify a governing standard or concentration-averaging interval; 60 ppm is presented here as this study’s criterion.
Use the flow field to explain the concentration pattern
The velocity contour shows variation in air speed along the result plane. The study used this view to examine regions of low velocity, recirculation and local acceleration within the tunnel.
The streamline view complements the plane contour by showing the predicted routes of airflow through the domain and around vehicle obstructions. It helps the reader relate the fan locations to the wider circulation pattern.
04 / ENGINEERING VALUE
Connect the ventilation arrangement with its CO result
The assessment provided a documented basis for reviewing the proposed jet-fan arrangement against the project’s CO criterion. It paired the reported maximum concentration with spatial flow evidence, making both the numerical result and the movement of air visible.
The practical finding was that the reported maximum of 56 ppm fell below the stated 60 ppm benchmark under the assessed conditions.
Assessment scope
The retained project presentation summarises a numerical evaluation. It does not establish measured tunnel performance, compliance with a named current standard, or performance during a vehicle-fire scenario.
Graphler Technology Solutions
Engineering design, simulation and product development.
About our engineering team
YOUR NEXT ENGINEERING QUESTION
Review your tunnel’s
ventilation performance.
Share the tunnel geometry, traffic assumptions, ventilation layout and assessment criteria. We can define a CFD study of airflow and pollutant distribution for your project.
Discuss a ventilation CFD projectExplore HVAC CFD services